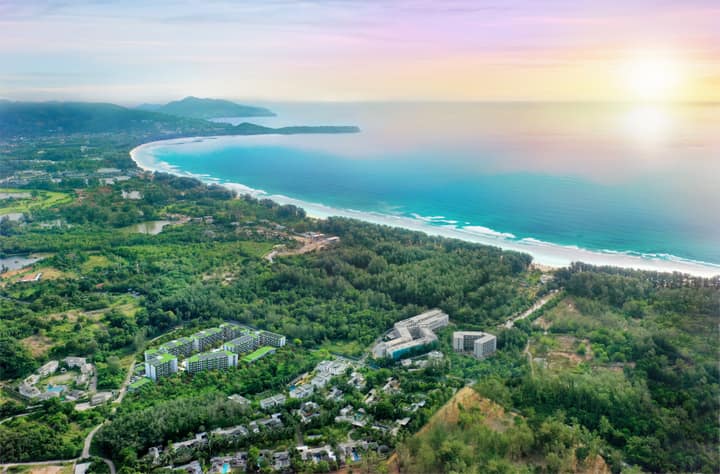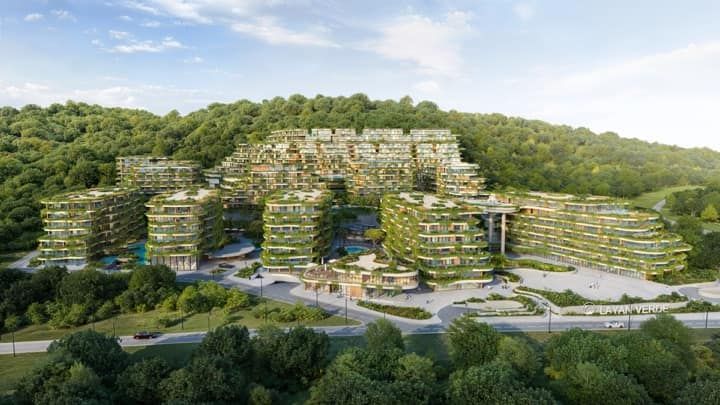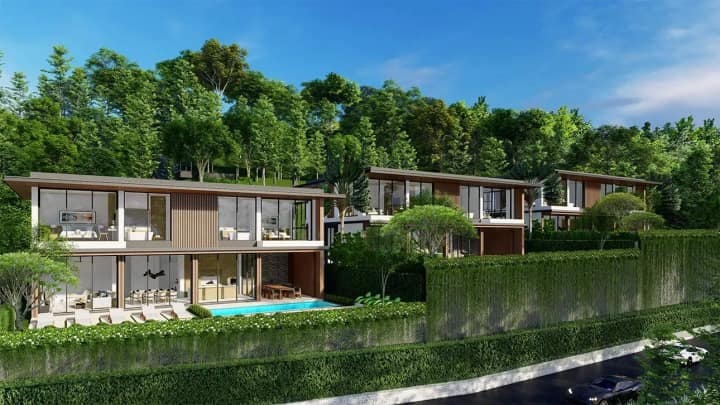
On 12 September 2026, the Thai Real Estate Research and Valuation Center at the Agency for Real Estate Affairs (AREA) put a single number on Phuket’s entire residential market for the first time in a while: 90,597 units across 806 projects worth a combined 705.055 billion baht. This isn’t a developer’s marketing figure or a forecast — it’s a snapshot of current supply, broken down by property type, district, sales pace and, separately, by who is actually driving demand. Here’s what makes up that number, why the resort segment accounts for 80% of value on just 52% of units, what a 5.2% monthly absorption rate means in practice, and what an investor should take away from the market’s structure rather than its headline.
Contents
- What AREA published, and when
- The market in numbers: 705bn baht
- The resort segment: 52% of units, 80% of value
- Who’s buying: Russia, Asia and the West
- The island’s geography: Thalang, Mueang Phuket, Kathu
- 2026’s new supply and sales pace
- 19.2 months: how long the backlog will take to clear
- AREA’s yield vs the pooled rental model
- Pitfalls: what the aggregate figure doesn’t show
- What this means for an investor
1. What AREA published, and when
AREA is one of Thailand’s oldest independent property-research bodies, led by Dr. Sopon Pornchokchai. Unlike developer reports or brokerage market notes, AREA’s methodology relies on a direct survey of the island’s projects: the center gathers data on every registered residential development — unit counts, sizes, actual prices and sales pace — rather than extrapolating from a sample.
The 12 September 2026 release (published on The Nation Thailand, credited as a republication from Thansettakij) is an updated annual snapshot of Phuket’s residential market: 806 projects, 90,597 units, a combined value of 705.055 billion baht. AREA also breaks out new supply launched during 2026, sales pace by property type, and — in a separately quoted section we return to in part four — who is actually driving demand.
2. The market in numbers: 705bn baht
Before breaking down the structure, it’s worth fixing the baseline figures the rest of AREA’s analysis builds on:
| Metric | Value |
|---|---|
| Total projects | 806 |
| Total units | 90,597 |
| Combined market value | 705.055 billion baht |
| Units sold | 76,582 (85% of total) |
| Average unit price | 12.812 million baht |
| Average monthly absorption rate | 5.2% |
| Estimated time to clear remaining stock | 19.2 months |
An average unit price of 12.812 million baht isn’t the same thing as a “typical price” for any given buyer — it averages everything from compact townhouses at 2–3 million baht to resort villas at 20–40 million baht, covered in the next section. It’s a blended figure across the whole island and every segment at once, and its real value isn’t as a price benchmark but as a scale indicator: 705 billion baht is a market capitalisation comparable to the housing market of a mid-sized Thai provincial hub, concentrated on a single island with roughly 400,000 permanent residents.
3. The resort segment: 52% of units, 80% of value
The report’s central structural fact is how resort property — condo-hotels and holiday villas, typically run under a rental-management model — dominates ordinary housing not by unit count but by money:
| Property type | Units | Share of units | Value | Share of value |
|---|---|---|---|---|
| Resort condominiums | — | part of the 52% resort segment | 339.227bn baht | ~48% |
| Resort villas | — | part of the 52% resort segment | 221.672bn baht | ~31% |
| Resort segment, total | ~48,400 | ~52% | 560.899bn baht | ~80% |
| Residential condominiums | 21,392 | 24% | — | — |
| Townhouses | 9,729 | 11% | — | — |
| Semi-detached houses | 5,924 | 7% | — | — |
| Detached houses | 5,126 | 6% | — | — |
The logic is straightforward: a resort villa on average costs several times more than a townhouse or a compact residential condo, so even at an equal unit share the resort segment absorbs almost all of the market’s value. For an investor, this means the headline 705-billion-baht figure is, first and foremost, a story about the resort property market — not about housing for the island’s permanent residents, which exists (24% plus private homes) but makes up less than a quarter of the market’s money supply.
Within the resort segment itself, the structure isn’t uniform either: resort condominiums account for nearly 340 billion baht at a relatively accessible entry price (a sizeable share of listings fall in the 3–5 million baht range, per AREA’s separate price-tier breakdown), while resort villas sit mostly in the upper price bracket, from 20 million baht and up. In other words, “Phuket resort property” sounds like one category in a headline, but it actually combines two different products with different entry thresholds, different liquidity and different buyer profiles.
4. Who’s buying: Russia, Asia and the West
AREA doesn’t just count units — the center also tracks who is driving demand, and that’s the most-quoted part of the report. According to Dr. Sopon, Russian and CIS buyers remained an important source of demand in 2025–26 — a phrasing that lines up with the picture we already covered through Kommersant and Sunway Estates data on a 46.4% rise in Russian transactions in the first half of 2026. AREA is describing not a single deal or quarter but a two-year trend.
At the same time, AREA notes recovering demand from buyers in China, Hong Kong, Singapore and Taiwan — markets that had been noticeably weaker in 2023–2024 amid capital-flow restrictions and post-pandemic caution. Buyers from Western Europe and the Middle East, per AREA’s observation, are more often looking for retirement homes, holiday residences and larger family villas rather than investment studios — a pricier, more spacious format that also skews the market further toward resort villas in value terms. Thai buyers make up an estimated 15–25% of the premium segment, largely as second homes for leisure and savings diversification rather than as a primary residence.
5. The island’s geography: Thalang, Mueang Phuket, Kathu
AREA also breaks the data down by district, which shows where the resort segment is actually concentrated versus where housing for permanent residents sits:
| District | Projects | Dominant segment | Units in segment |
|---|---|---|---|
| Thalang (includes Layan, Bang Tao, Cherng Talay) | 411 | Resort condominiums | 24,994 (worth 236.807bn baht) |
| Mueang Phuket (Phuket City) | 281 | Residential condominiums | 11,794 |
| Kathu (includes Patong) | 84 | Residential condominiums | 6,940 |
Thalang — home to both Layan and Bang Tao — leads both in project count (411 of 806, more than half the island) and in resort-condominium concentration: nearly 25,000 units worth 236.807 billion baht, a third of the island’s entire resort-condo value sits here alone. This structurally confirms what’s already visible without AREA’s report: the west coast’s infrastructure and proximity to Layan and Bang Tao beaches have long made Thalang the island’s primary resort cluster rather than just one location among many. Mueang Phuket and Kathu, by contrast, show the structure of the city and Patong: residential condos for permanent living and short stays dominate there rather than resort villas.
6. 2026’s new supply and sales pace
2026 has already brought 13,779 new units worth a combined 176.538 billion baht to market, averaging around 10 million baht per unit — slightly below the market-wide average of 12.812 million baht, meaning new supply is, on average, marginally more affordable than the existing stock. Meanwhile, the pace at which the market absorbs different property types varies sharply:
- Residential condominiums — 8.1% a month, the fastest-selling category overall.
- Resort property (condo-hotels and villas) — 4.9% a month.
- Other housing (townhouses, houses) — around 3% a month.
At first glance this looks like a paradox: the resort segment, which drives most demand and 80% of the market’s value, sells more slowly than residential condos. The explanation is simple — residential condos are cheaper on average and more liquid, the entry threshold is lower, and the buying decision moves faster. Resort property involves a larger ticket size and often a yield and management-model evaluation, so the deal cycle is naturally longer even when demand is strong.
7. 19.2 months: how long the backlog will take to clear
Of 90,597 units on the market, 76,582 are sold — 85%. AREA estimates the remaining 14,015 units, at a 5.2% monthly absorption rate, will take roughly 19.2 months to clear — a little over a year and a half.
It’s worth stressing this isn’t a forecast of a price crash or oversupply: 19.2 months is a standard horizon for a healthy property market that’s continuously replenished with new supply (13,779 units in 2026 alone). The figure is useful as a balance indicator: if the clearing time starts rising steadily at the same rate of new launches, that would signal cooling demand; if it shortens, that would signal a supply shortage — something AREA has already flagged in specific segments of Phuket’s market before, for instance in the 2026 island-wide price-trend overview.
8. AREA’s yield vs the pooled rental model
It’s important not to conflate two figures that sound similar but mean different things. AREA estimates the average yield on the island’s resort condominiums and villas at 6–8% a year — a blended market benchmark where each owner arranges their own rental and management: finding their own operator or agent, negotiating their own commission, and carrying their own vacancy risk in the low season.
Flagship projects that run a pooled rental model — Layan Green Park, for instance — work differently: identical-type units are combined into a shared pool, the owner receives 60% of the pool’s net profit and the management company keeps 40%, handling occupancy, pricing and seasonal distribution across every unit in the pool. The benchmark under this model runs around 8–10% net a year — above AREA’s market-wide estimate. The gap isn’t some developer’s “magic”; it comes from a straightforward scale economy: a unified booking system, professional revenue management and occupancy spread across a hundred-plus units simply outperform an individual owner managing a single unit alone. For a corrected methodology that accounts for an owner’s actual costs, see our separate guide on how to calculate ROI in Phuket.
9. Pitfalls: what the aggregate figure doesn’t show
The 705-billion-baht figure works well as a scale benchmark, but it’s easy to stumble if you apply it directly to an investment decision:
- It isn’t a breakdown by specific location. AREA doesn’t single out Layan — the data is given at the level of the whole Thalang district, which also includes Bang Tao and Cherng Talay, each with different dynamics inside it.
- The average price hides the spread. 12.812 million baht is an average across every property type at once; a 3-million-baht studio and a 40-million-baht villa both feed into that calculation.
- “Stock” isn’t “demand.” 705 billion baht is the volume of supply on the market, not the volume of deals actually closed over a period; tracking demand requires separate transaction data, such as the Russian buyer figures Kommersant and Sunway Estates reported earlier.
- A 6–8% yield is a market average, not a guarantee. Individual management produces a wider spread of outcomes than a pooled model does: some owners will beat the average, others will fall noticeably short, especially without professional occupancy management.
- The data is a snapshot on the report date. Phuket’s market is replenished quickly with new supply (13,779 units in 2026 alone), so the mix and proportions between segments will keep shifting from one report to the next.
10. What this means for an investor
AREA’s report doesn’t tell an investor what to buy, but it does offer three practical reference points. First, scale: Phuket’s housing market isn’t a niche story for a narrow circle of buyers — it’s a 705-billion-baht market that’s 85% sold through, with a steady absorption rate, hallmarks of a mature market rather than a speculative one. Second, the structure of demand: Russian and CIS buyers have remained a key source of demand for a second consecutive year, confirmed independently by both AREA’s report and earlier transaction-volume figures. Third, the yield gap between individual management (6–8% per AREA) and a professionally run pooled model (an 8–10% benchmark) isn’t an abstraction — it’s a concrete ownership-structure choice that should be made before, not after, a purchase.
I can send you the current supply breakdown for the district you’re interested in, compare individual management against pooled-rental yield using real project figures, and work out entry cost against your budget. Leave a request or browse the available projects on the agency page.
This material is for informational purposes only and does not constitute investment advice. Figures are sourced from AREA (Thai Real Estate Research and Valuation Center) as of the report’s publication date, 12 September 2026; yield benchmarks are target figures, not a guaranteed outcome.