“Property in Thailand” is too broad a phrase: the price per square metre in central Bangkok, on Phuket’s beachfront and in inland Chiang Mai can differ by 3–4x. Here’s how the regional price map is actually built, what genuinely drives it, and why an investor who compares only the headline price usually misses the point — yield and liquidity.
Contents
- What drives the price per m²
- Bangkok: the capital market
- Phuket: where it’s expensive, and where it isn’t
- Pattaya and the east coast
- Koh Samui and the southern islands
- Chiang Mai and the mainland north
- Regional comparison table
- Pitfalls when comparing regions
- Mini case: an investor picks a region
- Conclusion and next step
1. What drives the price per m²
Property pricing in Thailand isn’t one market — it’s several parallel ones, each with its own logic:
- Distance to the sea and beach. On resort coasts, price drops the further you go from the water — sometimes 2–3x over just 10–15 minutes.
- Tourist flow and rental demand. Regions with year-round international tourism (Phuket, Samui) hold prices above inland cities.
- Land scarcity for new construction. Along popular beachfronts, almost no free land is left — that structurally props up price.
- The project’s construction stage. Off-plan at launch is always cheaper than a completed unit in the same building — the mechanics are covered in off-plan vs ready.
- Unit format. A studio in a managed condo-hotel and a standalone villa with land sit in different price categories even within the same district — see condo vs villa.
2. Bangkok: the capital market
Bangkok is the country’s largest and most liquid property market, but it runs on different logic than the resorts. Price is set by proximity to the BTS/MRT lines and business districts (Sukhumvit, Silom, Sathorn), not the beach. Premium new builds downtown cost well above the city average, while outer residential districts run noticeably cheaper. Yield in Bangkok is usually built on long-term rentals to locals and expats rather than tourist flow, which makes it more predictable but typically lower than the resort model. On how capital moves between the capital and the resorts, see the Bangkok → Phuket demand shift.
3. Phuket: where it’s expensive, and where it isn’t
Phuket is the country’s most uneven market by price — the gap between the west coast and the east of the island can be several-fold.
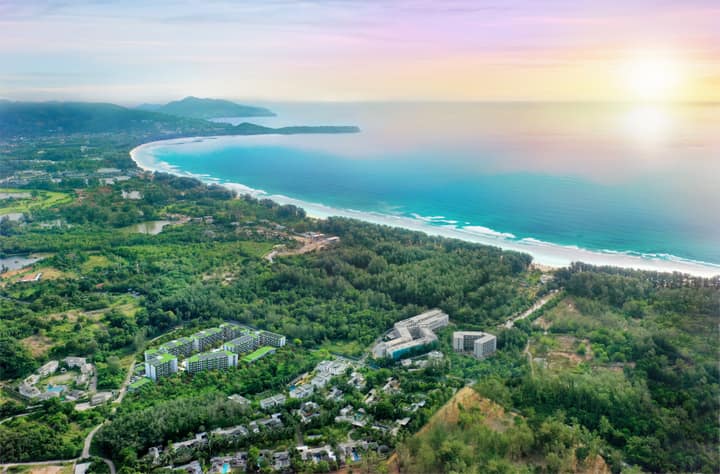
- West-coast beachfront (Layan, Bang Tao, Surin) — land scarcity, international developers, steady tourist flow. This is the island’s most expensive and, at the same time, most liquid segment.
- Second and third rows on the west coast — prices run 20–40% lower, 5–15 minutes from the beach by car.
- East and south of the island (Panwa, Rawai) — quieter and cheaper, but rental demand is usually weaker than the top west-coast beaches.
- Phuket Town and the island’s centre — the most budget-friendly segment, geared more toward long-term local rentals than tourists.
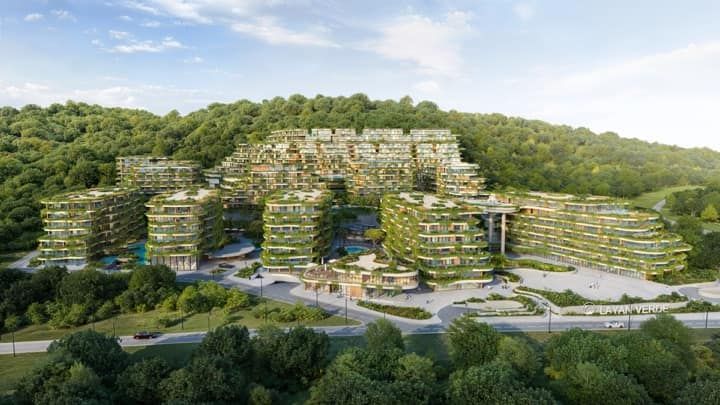
It’s along Layan’s beachfront that projects like Layan Verde operate — 774 residences 700 m from the beach, priced from $235,995 for a studio (price list as of 01.09.2026) — and Layan Green Park, Phuket’s first eco condo-hotel with EDGE certification. For the island’s full price dynamics, see Phuket property prices: 2026 trends.
4. Pattaya and the east coast
Pattaya has historically been the country’s most accessible resort market by entry ticket, right next to Bangkok (about two hours by road). Price per m² here runs noticeably below Phuket for a comparable beachfront condo format. The flip side is more uneven construction quality and not always transparent rental management programs: check the developer carefully before buying — see how to choose a developer and developer red flags.
5. Koh Samui and the southern islands
Samui is the country’s second most significant island resort after Phuket, with its own airport and growing tourist flow. Prices per m² here usually run below Phuket’s west coast but above Pattaya — a reflection of more limited logistics (an island with no bridge) and a smaller volume of new supply. The unit mix skews toward villas and low-rise condos; large international condo-hotels with management programs are noticeably scarcer than on Phuket.
6. Chiang Mai and the mainland north
Chiang Mai is the most budget-friendly of the major regional markets: no sea, but a low cost of living and a large community of long-term expats and remote workers. Price per m² here typically runs 2–3x below Phuket’s beachfront. This is a market for living and long-term rental, not resort-style yield — the tourist rental flow doesn’t compare to the coastal regions.
7. Regional comparison table
Approximate price-per-m² ranges for new mid- and premium-class condos — market-wide, not tied to any specific project:
| Region | Budget segment | Mid segment | Beachfront / premium |
|---|---|---|---|
| Bangkok (city) | $1,800–2,500/m² | $2,800–4,500/m² | from $5,500/m² (downtown) |
| Phuket (west) | $2,200–3,000/m² | $3,500–5,000/m² | from $6,000/m² (Layan, Bang Tao) |
| Phuket (east/centre) | $1,500–2,000/m² | $2,200–3,200/m² | from $3,800/m² |
| Pattaya | $1,400–1,900/m² | $2,000–3,000/m² | from $3,800/m² |
| Koh Samui | $1,800–2,400/m² | $2,800–4,000/m² | from $4,800/m² |
| Chiang Mai | $900–1,300/m² | $1,500–2,100/m² | from $2,800/m² |
For a “whole house” comparison rather than condo m², see the separate table in how much a house costs in Thailand. Figures in both tables are a market benchmark as of publication, not a quote for a specific unit — confirm the current price list at the time of the deal.
8. Pitfalls when comparing regions
- Comparing only the headline price per m². The same figure can hide a different construction stage, finish quality, and whether a rental management program exists.
- Ignoring yield and liquidity. A cheaper region isn’t always the better deal: without tourist flow and rental demand, a low entry price doesn’t convert into income.
- “5 minutes to the beach” unverified. Listings often measure distance by car along a winding road, not on foot in a straight line.
- Ignoring the exchange rate at deal time. Prices are quoted in baht or dollars — rate swings change the final entry price for a foreign buyer.
- Treating an island or city as uniform. Phuket is the best example: price and liquidity on the west-coast beachfront and inland districts differ several-fold — see Phuket’s best areas for investment.
9. Mini case: an investor picks a region
An investor with a roughly $250,000 budget weighed three options: a condo in a residential Bangkok district, a beachfront condo in Pattaya, and a studio in an under-construction complex near Layan Beach, Phuket. The Bangkok option gave the lowest yield — a long-term local rental market with no tourist premium. Pattaya won on entry price, but the rental management program at the developer under review was opaque, with no historical occupancy data available. The final choice was a Phuket studio at the construction stage: a clear rental-pool model (60% of net profit to the owner, 40% to the management company), a benchmark yield of roughly 8–10% net per year with a payback of about 12 years, and value growth to handover driven by the beachfront supply shortage.
10. Conclusion and next step
Thailand’s property price map isn’t a “more expensive vs cheaper” ranking — it’s a set of different investment models: Bangkok for liquidity and long-term rental, Pattaya and Samui as a trade-off between entry price and tourist flow, Chiang Mai for life without the sea, and west-coast Phuket’s beachfront as the premium tier with the country’s steadiest demand and yield. Choose a region by your goal — personal living, long-term rental, or managed resort yield — not by the price per m² alone.
I’ll match a district and project to your budget and goal, run the yield numbers, and share the current price list — leave a request or browse the VillaCarte Group catalogue.
This material is informational only and is not investment advice. Regional prices are approximate market ranges as of publication — confirm current figures at the time of the deal.