A buyer of an apartment in Phuket almost always asks the same question at some point: “Are the tourists actually coming?” The answer is usually sought in headlines — “record” or “decline” — and that is exactly where it is easiest to go wrong. A headline describes the whole island, while the income of your unit depends on very specific things: the season, the location, the class of the property, the management model and the price per night. In this article we go through the latest official TAT Phuket statistics for January–August 2026: 9.2 million visitors, −1.76% on last year, industry revenue of about THB 356 billion and average hotel occupancy of 66.2%. We look at what these figures are made of, which ones matter to an apartment owner, which are just noise, and how to translate island-wide statistics into the language of your own yield.
A note on method up front: every external figure in this article comes from TAT data and press reports that we date and cite; our own calculations (shares, averages, differences between periods) are explicitly labelled as calculations. There are no forecasts in the article except those clearly called forecasts. This is analysis, not investment advice. Earlier issues on the topic: arrivals for January–July and the weekly digest for week 41.
Contents
- What tourism statistics actually measure
- January–August 2026: the headline numbers
- Thai and foreign visitors: what revenue is made of
- Source markets: Russia, China, India
- Hotel occupancy: why the figures do not match
- October direct flights: what they change
- From island to unit: how arrivals become pool income
- Traps when reading tourism statistics
- Mini-case: two investors read the same report
- Investor checklist and conclusion
1. What tourism statistics actually measure
The Tourism Authority of Thailand (TAT) office in Phuket collects data on arrivals, industry revenue and hotel occupancy every month and presents it to the provincial administration. These figures are the main public gauge of the island’s tourism health. But it is important to understand what actually goes into them:
- Visitor count means people, not nights. A tourist who stays three days and a guest who stays two months in high season are counted the same way. For rental income, length of stay matters more than the number of arrivals.
- Industry revenue is money spent by tourists on the island: hotels, restaurants, tours, transport, shops. It is not revenue from renting apartments, and certainly not owners’ net income.
- Hotel occupancy is an averaged share of occupied rooms. It depends heavily on which hotels are in the sample and how room supply has changed.
- The whole island at once. Patong, Bang Tao, Layan, Kata, Rawai, Nai Harn — everything is averaged. The quiet north-west with premium supply lives differently from the mass-market west.
Hence the first rule: tourism statistics are a weather barometer, not a forecast of your yield. They answer “which way is the wind blowing”, not “how much will my unit earn”. For more on how occupancy of individual properties is measured, see our breakdown of seasons and occupancy in Phuket.
2. January–August 2026: the headline numbers
The data was presented at a meeting of the Phuket provincial administration and reported on 29 September 2026 (Khaosod English, The Thaiger). The main indicators for the eight months:
| Indicator, January–August 2026 | Value | Year on year |
|---|---|---|
| Total visitors | 9,200,166 | −1.76% |
| Foreign visitors | 6,790,293 | −2.52% |
| Thai visitors | 2,409,873 | +0.46% |
| Industry revenue | THB 356.21 bn | −0.99% |
| — from foreign visitors | THB 328.93 bn | −1.19% |
| — from Thai visitors | THB 27.29 bn | +1.44% |
| Average hotel occupancy | 66.20% | not stated in the source |
For context, compare this with the previous TAT report for January–July 2026: 8,096,059 visitors and revenue of THB 310.96 billion (details in our earlier analysis). Simple arithmetic (our calculation from the two TAT releases) gives August alone at roughly 1.10 million visitors and about THB 45 billion of revenue. The year-on-year decline across all key lines remains small — on the order of one to two percent, not a collapse.
What matters: the fall in the foreign flow (−2.52%) is larger than the overall one (−1.76%), because domestic Thai demand is edging up. And revenue falls less than the visitor count (−0.99% versus −1.76%): spending per visitor has not collapsed. In other words, the island is losing less money than it is losing part of its mass-market flow. For the segment our projects operate in, this is closer to a neutral signal than an alarming one — but, again, conclusions should not be drawn from a single report.
3. Thai and foreign visitors: what revenue is made of
Thai tourists make up slightly over a quarter of visitors but only a small share of the money. Our calculation from TAT data for January–August 2026:
| Indicator (calculated) | Foreign | Thai |
|---|---|---|
| Share of visitors | ≈ 74% | ≈ 26% |
| Share of revenue | ≈ 92% | ≈ 8% |
| Revenue per visitor | ≈ THB 48,400 | ≈ THB 11,300 |
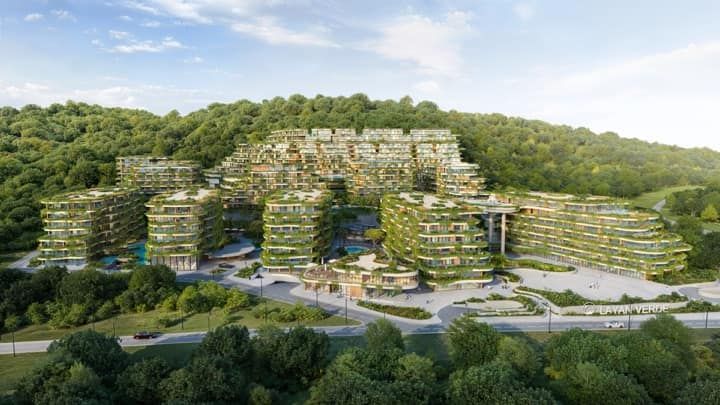
A gap of more than four times has an obvious explanation: foreign guests fly further, stay longer and spend more on accommodation and getting around the island. The takeaway for an investor is simple: premium beachside property depends on the foreign flow, not the domestic Thai one. Growth in Thai tourism (+0.46%) is pleasant for the statistics, but it cannot replace foreign demand in revenue terms. If the foreign segment grows in the coming quarters, it is first of all good news for projects such as Layan Verde and Layan Green Park, which target the international guest.
The flip side: the foreign flow depends on flights, visa rules and exchange rates. Any change in these shows up in industry revenue faster than fluctuations in domestic demand.
4. Source markets: Russia, China, India
The structure of the foreign flow in January–August 2026 according to TAT:
| Rank | Country | Visitors, January–August 2026 |
|---|---|---|
| 1 | Russia | 661,876 |
| 2 | China | 459,218 |
| 3 | India | 393,277 |
| 4 | Australia | 167,345 |
| 5 | United Kingdom | 152,866 |
| 6 | Germany | 115,795 |
| 7 | France | 111,701 |
| 8 | Malaysia | 101,639 |
| 9 | South Korea | 90,341 |
| 10 | Kazakhstan | 86,071 |
The top three together account for about 1.51 million people, or roughly 22% of the entire foreign flow (our calculation). That means 78% of foreign guests come from other countries: the island is reasonably diversified and no single market decides everything. Still, the reliance on three sources is noticeable, and an investor should keep three things in mind:
- Russia is the largest market. For its position in January–July see our previous analysis; it is important not to confuse tourists with property buyers — they are different funnels.
- China is the most volatile of the large markets: its flow is sensitive to flights, visa regimes and the “safety image”. Industry analysts link part of the occupancy dips to fewer Chinese guests.
- India is a fast-growing audience, but more budget-oriented with shorter trips; it matters more for mass-market accommodation than for premium apartments.
For long-stay guests and owners who use their unit themselves, another cluster matters more — Europeans, Australians and Britons who come for the high season for extended periods. Their share in the list is stable: Australia, the UK, Germany and France together account for about 548 thousand visitors (our calculation).
5. Hotel occupancy: why the figures do not match
The most common confusion in tourism statistics is occupancy. In the January–July 2026 report TAT cited average hotel occupancy of 75.56% (−1.74% year on year), while in the January–August report the figure is 66.20%. It looks as though occupancy collapsed in August alone. It did not, and here is why:
- Different methodology and sample. A cumulative recalculation over a different set of hotels gives a different level. The source does not explain what is being compared.
- One month cannot shift an eight-month average that far. To move from an average of 75.56% over seven months to 66.20% over eight, August would have had to show occupancy close to zero — which is obviously unrealistic.
- Seasonality. May–October is the “green” season with lower occupancy; this is the island’s normal annual cycle, not a crisis.
Conclusion: do not compare occupancy figures from different reports. Compare only the year-on-year change within one source and one methodology. To assess a specific project, look at the actual occupancy of the pool and the full annual cycle — not monthly island-wide snapshots. How costs and income distribution in a pool work is covered in our article on management fees, and hotel licensing in the piece on the hotel licence.
6. October direct flights: what they change
Alongside the statistics, the reports announced the launch of four new direct routes to Phuket in October 2026:
| Airline | Route | Start | Frequency |
|---|---|---|---|
| Virgin Atlantic | London — Phuket | 18 October | 3 per week |
| Edelweiss Air | Zurich — Phuket | 25 October | 3 per week |
| Kuwait Airways | Kuwait — Phuket | 27 October | 2 per week |
| Belavia | Minsk — Phuket | 29 October | 2 per week |
What this means in substance. A direct flight lowers the barrier for a European guest planning a “long season” stay: no connection removes one of the inconveniences of a long trip. London and Zurich are high-income markets with a tendency towards pricier accommodation, which is exactly the segment that fills premium apartments near the north-west beaches. However, a new route is an opportunity, not a guarantee: airlines open and close routes, and load factors at launch are usually below plan. We do not attempt to estimate how many extra guests each flight will bring; that can only be done properly from actual arrivals in the next high season.
On infrastructure: details about the airport itself and routes to properties are in our Phuket airport guide, and distances from our projects to the airport are given in the catalogue cards (Layan Verde — about 20 minutes by car, Layan Green Park — about 23 minutes).
7. From island to unit: how arrivals become pool income
Between “9.2 million visitors on the island” and “owner’s income” lies a chain of five links. It is useful to walk through it in full:
| Link in the chain | What affects it | What the investor should watch |
|---|---|---|
| 1. Arrivals to the island | Flights, visas, exchange rate, weather | TAT data year on year |
| 2. Demand for your area | Beach, infrastructure, image | Trends in Layan and Bang Tao |
| 3. Occupancy of your property | Class, brand, management | Actual pool occupancy by month |
| 4. Average room rate | Season, competition, service | ADR by season, not an annual “record” |
| 5. Owner’s share | Costs, management fee, taxes | 60% of pool net profit to the owner, 40% to the management company |
The rental model in our projects: the owner receives 60% of the pool’s net profit, the management company 40%. The yield benchmark is ~8–10% net per year with a payback of about 12 years; these are programme targets, not guaranteed income. A 1–2% swing in overall arrivals is only the first link in the chain; it does not translate into owner income one-to-one. To see the full picture and run your own scenario, use the calculator on the home page and our guide on how to calculate ROI in Phuket; for a general view of yield see the article on rental yield in Phuket.
Now entry prices, so the figures are comparable. According to the current catalogue, studios in Layan Verde start from $235,995 (7,833,125 THB), in Layan Green Park phase 2 from $224,043 (7,424,784 THB); in the completed phase 1 only resales from owners are available, studios from $142,602 (4,800,000 THB), full payment. The choice between them is a question of horizon and cash flow, not of one line in the tourism statistics; for a comparison of the projects see Layan Verde vs Layan Green Park.
8. Traps when reading tourism statistics
Typical mistakes that lead investors to wrong conclusions:
| Trap | What it looks like | How to avoid it |
|---|---|---|
| One month instead of a trend | “It fell in August — the market is weakening” | Look at cumulative totals and quarterly dynamics |
| Mixing up periods | Comparing occupancy of 75.56% (Jan–Jul) with 66.20% (Jan–Aug) | Compare one source and one methodology |
| Island instead of property | “Island occupancy is 66%, so mine is too” | Ask for actual pool occupancy by month |
| Visitor count instead of revenue | “Fewer guests — less money” | Look at revenue too: it fell less than the flow |
| Record instead of cycle | “Last year was a record, so this year is worse” | Compare at least three years and seasonality |
| Tourists instead of buyers | “Arrivals are rising, so property prices will rise” | Purchase demand is driven by other factors |
| New route as a guarantee | “A flight appeared — occupancy will grow” | Wait for actual arrivals, not announcements |
The last pair is especially treacherous. Growth in arrivals does not equal growth in property prices, and an announced flight is not a full flight. A detailed list of typical buyer mistakes is in our article on common investor mistakes in Phuket.
9. Mini-case: two investors read the same report
A hypothetical example (not a real transaction; the figures are for illustrating the logic). Two investors look at the same news item: “Phuket arrivals −1.76%”.
Investor A reads only the headline, decides the market is weakening and postpones the decision “until better times”. They do not check that industry revenue fell by only 0.99%, that the foreign segment generates about 92% of revenue, or that new flights from London and Zurich appear in October. A year later they are comparing not data but their own impressions.
Investor B asks three questions. First, is the methodology of the reports comparable. Second, how is the premium segment near a specific beach behaving, rather than the whole island. Third, what is the actual pool occupancy in the project over recent seasons and what is the owner’s share after costs. They ask the agent for the monthly dynamics, look at owner costs (in Layan Verde — CAM of THB 85/m² per month, in Layan Green Park — THB 75/m² per month, plus a one-off sinking fund) and calculate net yield against the 8–10% benchmark, building in a margin for a weak season.
The result is not that B “called the market”. The result is that B makes the decision based on the facts of their own property rather than averaged statistics. That is what distinguishes an investor from an observer.
10. Investor checklist and conclusion
What to do with tourism statistics in practice:
- Refresh your picture once a quarter from TAT releases rather than reacting to every headline.
- Compare the same source year on year: visitors, revenue, occupancy.
- Look at the foreign segment separately — it generates the bulk of revenue.
- Follow direct flights and airline seasonal schedules, but judge the effect by actual results.
- Ask the management company for monthly occupancy and average room rate for the property.
- Build in a margin for the weak season: May–October is a normal low-occupancy period.
- Do not decide on a purchase from a single news item; check it against your holding horizon and goal — capital growth or cash flow.
Conclusion. In January–August 2026 Phuket received 9.2 million visitors — 1.76% fewer than last year; industry revenue was about THB 356 billion (−0.99%) and the foreign flow fell 2.52%. This is a small decline, not a collapse, and it does not carry over automatically to the yield of a specific unit. For an apartment owner, actual pool occupancy, seasonality and management terms matter more. Island-wide figures are the background; the decision is made at the level of the property.
If you want to go through a specific project — Layan Verde or Layan Green Park — and run a scenario for your horizon and budget, get in touch: we will match an option to your brief, show the current price list and answer yield questions. Terms of working with the agency: a market commission, details at a meeting. This material is informational and is not investment or legal advice.